

| Название компании | Последняя цена | Доходность, 7д | Доходность, 1г | Капитализация | Оценка | Рост | Див. доходность | Отрасль |
|---|---|---|---|---|---|---|---|---|
 Bunge Limited BG | 103,22 $ | - | - | 20,19 млрд $ | 9,16 | 88,28% | 2,27% | Consumer Staples |
 Synchrony Financial SYF | 73,64 $ | - | - | 24,11 млрд $ | 7,03 | -0,77% | 1,87% | Financials |
 Brown & Brown, Inc BRO | 72,97 $ | - | - | 24,64 млрд $ | 15,09 | 34,19% | 0,99% | Financials |
 Restaurant Brands International Inc QSR | 75,34 $ | - | - | 33,85 млрд $ | 17,06 | 4,56% | 2,99% | Consumer Discretionary |
 Devon Energy Corporation DVN | 51,39 $ | - | - | 51,41 млрд $ | 10,17 | 73,13% | 2,6% | Energy |
 InterContinental Hotels Group PLC IHG | 162,40 $ | - | - | 24,51 млрд $ | 24,17 | 14,51% | 1,17% | Consumer Discretionary |
HUBB Hubbell Incorporated HUBB | 448,10 $ | - | - | 24,35 млрд $ | 19,99 | 15,33% | 1,36% | Industrials |
 Archer-Daniels-Midland Company ADM | 80,14 $ | - | - | 37,39 млрд $ | 14,66 | 7,05% | 4,13% | Consumer Staples |
 Omnicom Group Inc OMC | 82,68 $ | - | - | 22,68 млрд $ | 7,32 | 59,09% | 3,88% | Communication Services |
 PPG Industries, Inc PPG | 110,61 $ | - | - | 26,53 млрд $ | 12,77 | 7,15% | 2,71% | Materials |
 Texas Pacific Land Corporation TPL | 338,26 $ | - | - | 24,53 млрд $ | 34,91 | 31,2% | 0,71% | Energy |
 Ørsted A/S DOGEF | 19,60 $ | - | - | 396,81 млрд $ | - | 692,12% | 3,48% | Utilities |
 PulteGroup, Inc PHM | 121,19 $ | - | - | 23,09 млрд $ | 12,85 | -9,78% | 0,86% | Consumer Discretionary |
 Darden Restaurants, Inc DRI | 212,40 $ | - | - | 22,68 млрд $ | 18,66 | 5,11% | 3,24% | Consumer Discretionary |
 Coca-Cola FEMSA, S.A.B. de C.V KOF | 118,11 $ | - | - | 22,84 млрд $ | 14,97 | 12,2% | 4,14% | Consumer Staples |
 Nomura Holdings Inc ADR NMR | 8,98 $ | - | - | 29,03 млрд $ | 12,05 | 3,23% | 5,15% | Financials |
 Global Payments Inc GPN | 82,82 $ | - | - | 23,00 млрд $ | 5,14 | 69,71% | 1,21% | Financials |
 STERIS plc STE | 232,15 $ | - | - | 22,59 млрд $ | 20,95 | 7,3% | 1,19% | Healthcare |
 Tapestry, Inc TPR | 110,37 $ | - | - | 26,06 млрд $ | 14,08 | 8,9% | 1,68% | Consumer Discretionary |
 Packaging Corporation of America PKG | 247,29 $ | - | - | 22,18 млрд $ | 18,48 | 12,46% | 2,41% | Materials |
 ASE Technology Holding Co. Ltd ASX | 38,69 $ | - | - | 77,33 млрд $ | 21,02 | 23,11% | 3,15% | Information Technology |
 HF Sinclair Corporation DINO | 121,66 $ | - | - | 16,22 млрд $ | 14,15 | 53,15% | 1,73% | Energy |
 Nokia Corporation NOK | 8,14 $ | - | - | 45,57 млрд $ | 16,53 | -9,54% | 3,36% | Information Technology |
 Equifax Inc EFX | 182,36 $ | - | - | 20,63 млрд $ | 18,87 | 9,55% | 1,23% | Industrials |
 Citizens Financial Group, Inc CFG | 65,14 $ | - | - | 26,69 млрд $ | 10 | 5,83% | 3,53% | Financials |
 Best Buy Co., Inc BBY | 99,87 $ | - | - | 17,38 млрд $ | 15,02 | 3,61% | 3,84% | Consumer Discretionary |
 Broadridge Financial Solutions, Inc BR | 183,28 $ | - | - | 18,63 млрд $ | 17,6 | 7,59% | 2,38% | Industrials |
 Wipro Limited ADR WIT | 2,11 $ | - | - | 19,29 млрд $ | 14,64 | 9 575,89% | 4,11% | Information Technology |
 Shinhan Financial Group Co. Ltd SHG | 66,30 $ | - | - | 33,74 млрд $ | 7,44 | 39 251,52% | 3,8% | Financials |
 MetLife Inc Preferred Stock Series A MET-PA | 21,00 $ | - | - | 40,79 млрд $ | - | 4,44% | 5,99% | Financials |
VIV Telefônica Brasil S.A VIV | 12,96 $ | - | - | 22,55 млрд $ | 2,43 | -79,16% | 3,29% | Communication Services |
 Companhia de Saneamento Basico do Estado de Sao Paulo SABESP ADR SBS | 6,40 $ | - | - | 17,69 млрд $ | 11,55 | -77,61% | 0,54% | Utilities |
 Ecopetrol S.A EC | 17,80 $ | - | - | 33,53 млрд $ | 11,84 | 1,67% | 16,34% | Energy |
 nVent Electric PLC NVT | 125,40 $ | - | - | 24,88 млрд $ | 21,83 | 52,77% | 0,67% | Industrials |
 SYNNEX Corporation SNX | 247,34 $ | - | - | 20,79 млрд $ | 10,29 | 37,75% | 0,78% | Information Technology |
 HEICO Corporation HEI-A | 226,75 $ | - | - | 32,88 млрд $ | - | 23,13% | 0,11% | Industrials |
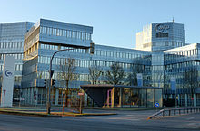 MTU Aero Engines AG MTUAY | 177,39 $ | - | - | 21,11 млрд $ | 9,25 | 25,43% | 1,2% | Industrials |
 Centrais Electricas Brasileiras SA EBR | 9,61 $ | - | - | 24,82 млрд $ | 9,73 | - | 0% | Utilities |
 Magna International Inc MGA | 63,97 $ | - | - | 18,67 млрд $ | 8,36 | 0,66% | 2,89% | Consumer Discretionary |
 Baxter International Inc BAX | 25,30 $ | - | - | 13,52 млрд $ | 12,5 | 5,34% | 3,14% | Healthcare |
 CF Industries Holdings, Inc CF | 120,68 $ | - | - | 17,93 млрд $ | 11,68 | 17,57% | 1,69% | Materials |
 Snap-on Incorporated SNA | 357,02 $ | - | - | 18,47 млрд $ | 17,18 | -0,74% | 2,73% | Industrials |
 HP Inc HPQ | 33,64 $ | - | - | 26,72 млрд $ | 11,23 | 12,53% | 6,11% | Information Technology |
 Lennar Corporation LEN | 84,92 $ | - | - | 19,20 млрд $ | 13,32 | -8,67% | 2,36% | Consumer Discretionary |
 Fortive Corporation FTV | 60,25 $ | - | - | 17,66 млрд $ | 18,66 | -27,79% | 0,46% | Industrials |
 Ares Management Corporation ARES | 122,08 $ | - | - | 42,25 млрд $ | 16,93 | 40,83% | 3,04% | Financials |
 Reliance Steel & Aluminum Co RS | 415,62 $ | - | - | 21,34 млрд $ | 16,71 | -99,86% | 1,43% | Materials |
 Singapore Exchange Limited SPXCY | 32,52 $ | - | - | 17,86 млрд $ | - | 30,22% | 2,16% | Financials |
 Reinsurance Group of America, Incorporated RGA | 263,94 $ | - | - | 16,08 млрд $ | 9,01 | 19,46% | 1,49% | Financials |
 Curtiss-Wright Corporation CW | 464,94 $ | - | - | 26,38 млрд $ | 27,18 | 13,41% | 0,22% | Industrials |


