

| Название компании | Последняя цена | Доходность, 7д | Доходность, 1г | Капитализация | Оценка | Рост | Див. доходность | Отрасль |
|---|---|---|---|---|---|---|---|---|
8038 Tohto Suisan Co Ltd 8038 | 1 000 000,00 ¥ | - | - | 29,32 млрд $ | - | - | 0% | Consumer Staples |
 SMC Corp 6273 | 62 350,00 ¥ | - | - | 4,65 трлн $ | 22,34 | 15,35% | 1,62% | Industrials |
 Eneos Holdings Inc 5020 | 1 454,50 ¥ | - | - | 3,59 трлн $ | 10,78 | 12,02% | 2,4% | Energy |
9022 Central Japan Railway Co. 9022 | 3 950,00 ¥ | - | - | 3,79 трлн $ | 7,53 | 3,02% | 0,82% | Industrials |
 BANDAI NAMCO Holdings Inc. 7832 | 6 243,00 ¥ | - | - | 3,43 трлн $ | 28,56 | 9,34% | 1,8% | Consumer Discretionary |
 Terumo Corp. 4543 | 2 387,50 ¥ | - | - | 3,50 трлн $ | 22,52 | 13,79% | 1,5% | Healthcare |
 Nomura Research Institute Ltd 4307 | 6 207,00 ¥ | - | - | 2,62 трлн $ | 29,41 | 7,5% | 1,36% | Information Technology |
7936 Asics Corp 7936 | 4 748,00 ¥ | - | - | 3,74 трлн $ | 23,72 | 29,74% | 0,82% | Consumer Discretionary |
 Lasertec Corp 6920 | 37 870,00 ¥ | - | - | 3,36 трлн $ | 34,44 | 3,55% | 1,04% | Information Technology |
5401 Nippon Steel Corp 5401 | 659,50 ¥ | - | - | 3,57 трлн $ | 10,16 | 40,45% | 18,59% | Materials |
 Konami Corp. 9766 | 24 620,00 ¥ | - | - | 2,80 трлн $ | 29,36 | 33,58% | 0% | Communication Services |
8267 Aeon Co. Ltd. 8267 | 1 174,00 ¥ | - | - | 3,12 трлн $ | 35,91 | 12,93% | 1,27% | Consumer Staples |
8830 Sumitomo Realty & Development Co. 8830 | 3 343,00 ¥ | - | - | 3,23 трлн $ | 13,51 | 20,42% | 1,56% | Real Estate |
 Kubota Corp. 6326 | 2 632,00 ¥ | - | - | 3,02 трлн $ | 11,93 | 18,57% | 1,99% | Industrials |
 Nippon Paint Holdings Co Ltd 4612 | 1 259,00 ¥ | - | - | 2,92 трлн $ | 14,08 | 15,03% | 1,27% | Materials |
4452 Kao Corp. 4452 | 3 792,00 ¥ | - | - | 3,31 трлн $ | 23,46 | 5,99% | 2,46% | Consumer Staples |
 Kansai Electric Power Co Inc 9503 | 2 764,50 ¥ | - | - | 2,72 трлн $ | 10,51 | -6,5% | 3,74% | Utilities |
 Secom Co. Ltd. 9735 | 6 822,00 ¥ | - | - | 2,62 трлн $ | 23,87 | 3,63% | 1,78% | Industrials |
7013 IHI Corp. 7013 | 2 418,50 ¥ | - | - | 2,91 трлн $ | 17,85 | 7,81% | 0,94% | Industrials |
 Shionogi & Co. Ltd. 4507 | 3 056,00 ¥ | - | - | 2,41 трлн $ | 11,87 | 63,67% | 2,5% | Healthcare |
 Obic Co Ltd 4684 | 5 969,00 ¥ | - | - | 1,81 трлн $ | 32,87 | 13,16% | 1,6% | Information Technology |
 Ryohin Keikaku Co. Ltd 7453 | 4 685,00 ¥ | - | - | 2,50 трлн $ | 44,51 | 20,29% | 0,93% | Consumer Discretionary |
 Nippon Yusen K.K 9101 | 7 231,00 ¥ | - | - | 2,47 трлн $ | 15,52 | 21,09% | 3,75% | Industrials |
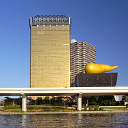 Asahi Group Holdings Ltd. 2502 | 1 702,50 ¥ | - | - | 2,52 трлн $ | 11,96 | - | 3,17% | Consumer Staples |
4062 Ibiden Co Ltd 4062 | 8 408,00 ¥ | - | - | 5,31 трлн $ | 39,27 | 18,65% | 0,35% | Information Technology |
 Kirin Holdings Co. Ltd. 2503 | 2 989,50 ¥ | - | - | 2,42 трлн $ | 13,75 | 4,98% | 2,55% | Consumer Staples |
 Daiwa Securities Group Inc. 8601 | 1 713,00 ¥ | - | - | 2,45 трлн $ | 14,16 | 32,87% | 3,86% | Financials |
 Nitto Denko Co 6988 | 3 599,00 ¥ | - | - | 2,29 трлн $ | 17 | 10,35% | 1,79% | Materials |
4091 Taiyo Nippon Sanso Corp 4091 | 5 377,00 ¥ | - | - | 2,66 трлн $ | 17,64 | 14,93% | 1,22% | Materials |
8795 T&D Holdings Inc. 8795 | 4 819,00 ¥ | - | - | 2,40 трлн $ | 15,08 | -39,08% | 3,42% | Financials |
 Olympus Corp. 7733 | 1 736,00 ¥ | - | - | 2,03 трлн $ | 19,95 | 8,51% | 0,96% | Healthcare |
 Nidec Corp 6594 | 1 711,00 ¥ | - | - | 1,97 трлн $ | 10 | - | 0% | Industrials |
1928 Sekisui House Ltd. 1928 | 3 549,00 ¥ | - | - | 2,18 трлн $ | 9,66 | -5,76% | 4,14% | Consumer Discretionary |
 Japan Exchange Group Inc 8697 | 2 200,00 ¥ | - | - | 2,34 трлн $ | 28,74 | 51,14% | 3,7% | Financials |
 Pan Pacific International Holdings Corp 7532 | 738,40 ¥ | - | - | 2,42 трлн $ | 18,17 | 10,77% | 1,75% | Consumer Discretionary |
 Osaka Gas Co. Ltd. 9532 | 5 901,00 ¥ | - | - | 2,10 трлн $ | 16,16 | 1,49% | 2,25% | Utilities |
 Dainippon Screen Mfg. Co. Ltd. 7735 | 11 310,00 ¥ | - | - | 2,27 трлн $ | 19,17 | 9,13% | 1,03% | Information Technology |
1812 Kajima Corp. 1812 | 4 793,00 ¥ | - | - | 2,33 трлн $ | 12,53 | -1,47% | 3,08% | Industrials |
 Nexon Co Ltd 3659 | 2 805,50 ¥ | - | - | 2,35 трлн $ | 20,02 | 33,62% | 29,93% | Communication Services |
5713 Sumitomo Metal Mining Co. Ltd. 5713 | 8 075,00 ¥ | - | - | 2,60 трлн $ | 10,97 | 22,55% | 2,57% | Materials |
 Asahi Kasei Corp. 3407 | 1 600,00 ¥ | - | - | 2,32 трлн $ | 13,12 | 4,52% | 2,79% | Materials |
 Tokyo Gas Co. Ltd. 9531 | 6 322,00 ¥ | - | - | 1,98 трлн $ | 17,24 | 4,03% | 1,92% | Utilities |
 Chubu Electric Power Co. Inc. 9502 | 2 659,00 ¥ | - | - | 2,04 трлн $ | 10,88 | 3,19% | 2,51% | Utilities |
 Furukawa Electric Co. Ltd. 5801 | 2 883,50 ¥ | - | - | 2,71 трлн $ | 3 | 12,17% | 0,76% | Industrials |
 Obayashi Corp. 1802 | 2 971,50 ¥ | - | - | 2,08 трлн $ | 12,85 | 2,01% | 3,22% | Industrials |
 Sumitomo Corporation 8053 | 1 751,00 ¥ | - | - | 7,91 трлн $ | 3,35 | 9,03% | 2,4% | Industrials |
6504 Fuji Electric Co. Ltd. 6504 | 13 105,00 ¥ | - | - | 2,09 трлн $ | 19,25 | 10,22% | 1,62% | Industrials |
 Daifuku Co Ltd 6383 | 5 223,00 ¥ | - | - | 2,27 трлн $ | 23,38 | - | 1,54% | Industrials |
9843 Nitori Holdings Co Ltd 9843 | 3 358,00 ¥ | - | - | 1,75 трлн $ | - | -2,35% | 0,95% | Consumer Discretionary |
 SBI Holdings, Inc 8473 | 2 900,00 ¥ | - | - | 1,96 трлн $ | 9,65 | 28,84% | 2,05% | Financials |